
Results
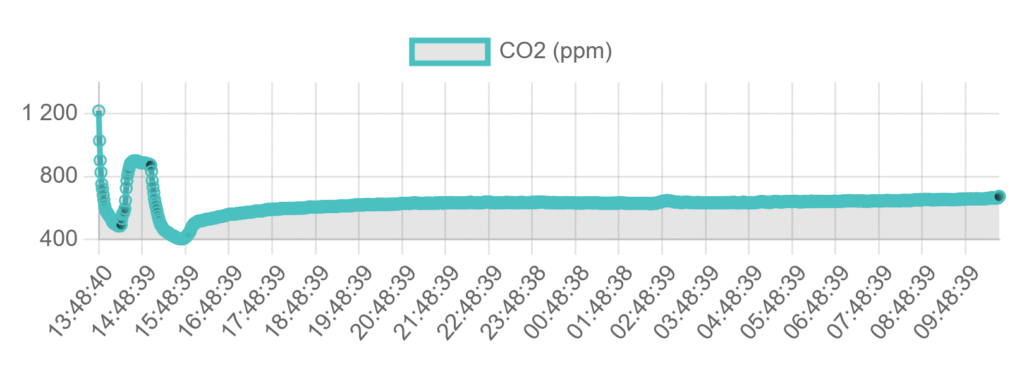
Online graph of CO2, temperature and humidity levels
of every minute from last 24 hours.
Avalable HERE
Inner structure

Hardware
Both the NDIR MH-Z14A and SHT45 sensors are connected to raspberry pi via I2C connection, with VCC and GROUND.
Data colection and distribution
All the data are colected at once and stored with timetag in one big txt file.
With each incoming mesurement the script also updates one smaller file with last 1440 mesurements that serves as faster acces to the last 24h of data.
Paralel to this runs a python flask website sending the file with 24h worth of data and simple html/js file to the current user.
For the data to be publicly visible, I used simple port rerout via autossh to the oracle server hosting this website.
Senzors used:
CO2:
NDIR MH-Z14A
https://www.laskakit.cz/ndir-senzor-plynu-mh-z14-oxid-uhlicity-co2/
Temperature and Humidity:
SHT45
https://www.aliexpress.com/item/1005008175340220.html